
- Published on
Distributed Tracing With OpenTelemetry and Jaeger In Spring Boot 3

- Authors
- Name
- Amrut Prabhu
- @amrutprabhu42

In my previous article “Distributed Tracing With Spring Cloud Jaeger”, we had seen how we can collect distributed traces from a Spring Boot application using Opentracing.
If you are not familiar with distributed tracing, you can read this article wherein I have explained what are traces and spans in distributed systems.
The Opentracing project has been archived, as a result of it being merged with OpenCensus to form a single universal framework for application tracing and metrics.
This new framework is called OpenTelemetry.
OpenTelemetry (OTel) is an open-source framework for collecting and analyzing observability data, like traces and metrics, from distributed systems. It provides APIs and libraries for developers to instrument their applications, gain insights into system performance, and integrate with various observability tools.
Let’s look at how we can send distributed traces to Jaeger using Opentelemetry.
Creating an application
Let’s go to https://start.spring.io and create an application with the following dependencies.
- Spring Web (required to create REST endpoints)
- Spring Boot Actuator
We will be using the micrometer collector in the actuator dependency to collect the traces and then use the OpenTelemetry dependency to export the traces.
For this, we would need to add the following dependencies.
 <dependency>
     <groupId>io.micrometer</groupId>
     <artifactId>micrometer-tracing-bridge-otel</artifactId>
  </dependency>
  <dependency>
     <groupId>io.opentelemetry</groupId>
     <artifactId>opentelemetry-exporter-otlp</artifactId>
  </dependency>
The dependency versions will be taken care of by the Spring Boot parent.
Next, we will create two endpoints in our application in the Controller class.
 private RestTemplate restTemplate;

    @Value("${spring.application.name}")
    private String applicationName;

    public Controller(RestTemplate restTemplate) {
        this.restTemplate = restTemplate;
    }

    @GetMapping("/path1")
    public ResponseEntity path1() {

        logger.info("Incoming request at {} for request /path1 ", applicationName);
        String response = restTemplate.getForObject("http://localhost:8090/service/path2", String.class);
        return ResponseEntity.ok("response from /path1 + " + response);
    }

    @GetMapping("/path2")
    public ResponseEntity path2() {
        logger.info("Incoming request at {} at /path2", applicationName);
        return ResponseEntity.ok("response from /path2 ");
    }
The idea here is to run the same application two times with different ports, such that one application calls the other applications on a different path.
When we invoke the /path1 endpoint, it will further call the /path2 endpoint on the predefined port 8090 of the server running on localhost.
Now to export the spans to Jaeger, we need to create a span exporter bean as follows.
@Bean
OtlpHttpSpanExporter otlpHttpSpanExporter(@Value("${tracing.url}") String url) {
    return OtlpHttpSpanExporter.builder()
            .setEndpoint(url)
            .build();
}
Along with this, we will define the Jaeger URL in the properties file to which the traces are to be reported.
spring:
  application:
    name: app

tracing:
  url: http://localhost:4318/v1/traces

management:
  tracing:
    sampling:
      probability: 1.0

logging:
  pattern:
    level: '%5p [${spring.application.name:},%X{traceId:-},%X{spanId:-}]'
Now here we are setting the probability of sampling the tracing to 1 so that every trace and span is reported to Jaeger.
We will also provide a custom logging format, so we can see the spans and traces in the application logs.
Now, before we start the application, let’s start Jaeger using docker-compose.
Starting Jaeger with Docker
To start Jaeger, we have the following docker-compose file.
version: '3.9'
services:
  jaeger:
    image: jaegertracing/all-in-one:latest
    ports:
      - 4318:4318
      - 16686:16686
    environment:
      - COLLECTOR_OTLP_ENABLED=true
For Jaeger to support the OpenTelemetry input format, we need to set the COLLECTOR_OTLP_ENABLED to true
With this, let's start the application as two separate instances on different ports.
java -jar \
target/Distributed-Service-0.0.1-SNAPSHOT.jar \
--spring.application.name=Service-1 \
--server.port=8080
java -jar \
target/Distributed-Service-0.0.1-SNAPSHOT.jar \
--spring.application.name=Service-2 \
--server.port=8090
Once the two applications are up and running, we call the endpoint /path1 on the first server.
curl localhost:8080/service/path1
Now, let’s visualize the traces in Jaeger UI.
To access the Jaeger UI, open the following URL.
http://localhost:16686/
When we select the service and click find traces, we will see the traces in the UI.

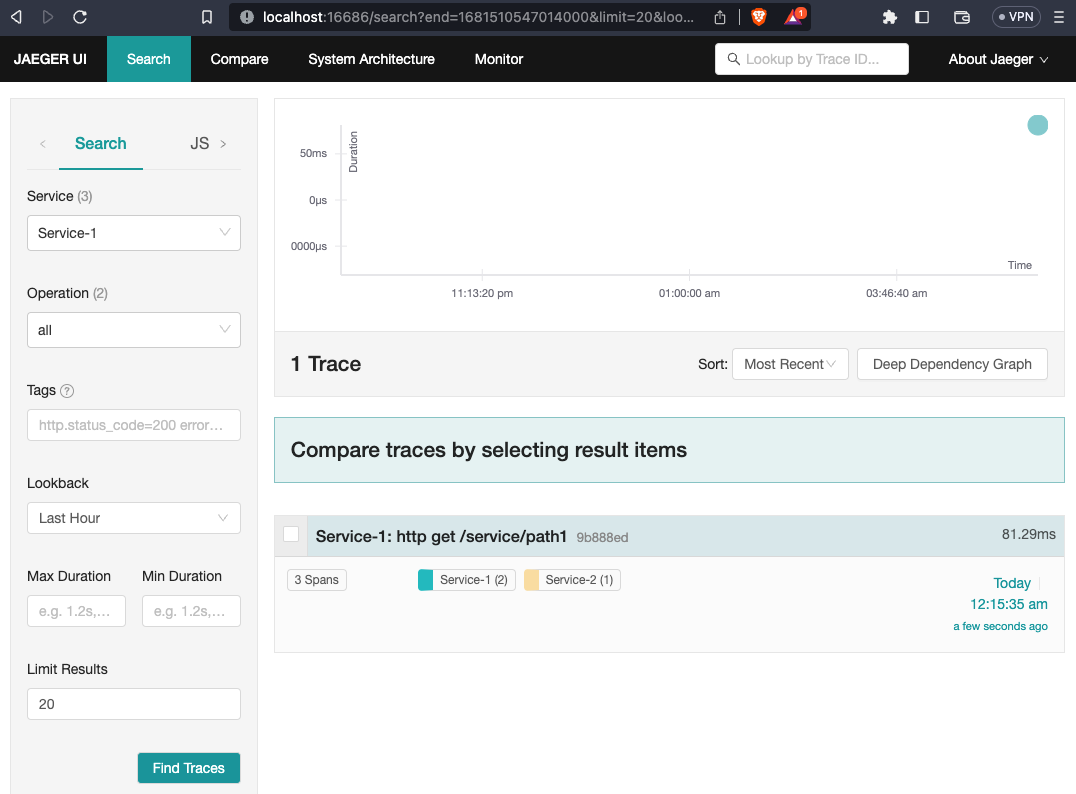
Let’s open the trace and see the various spans of the request.

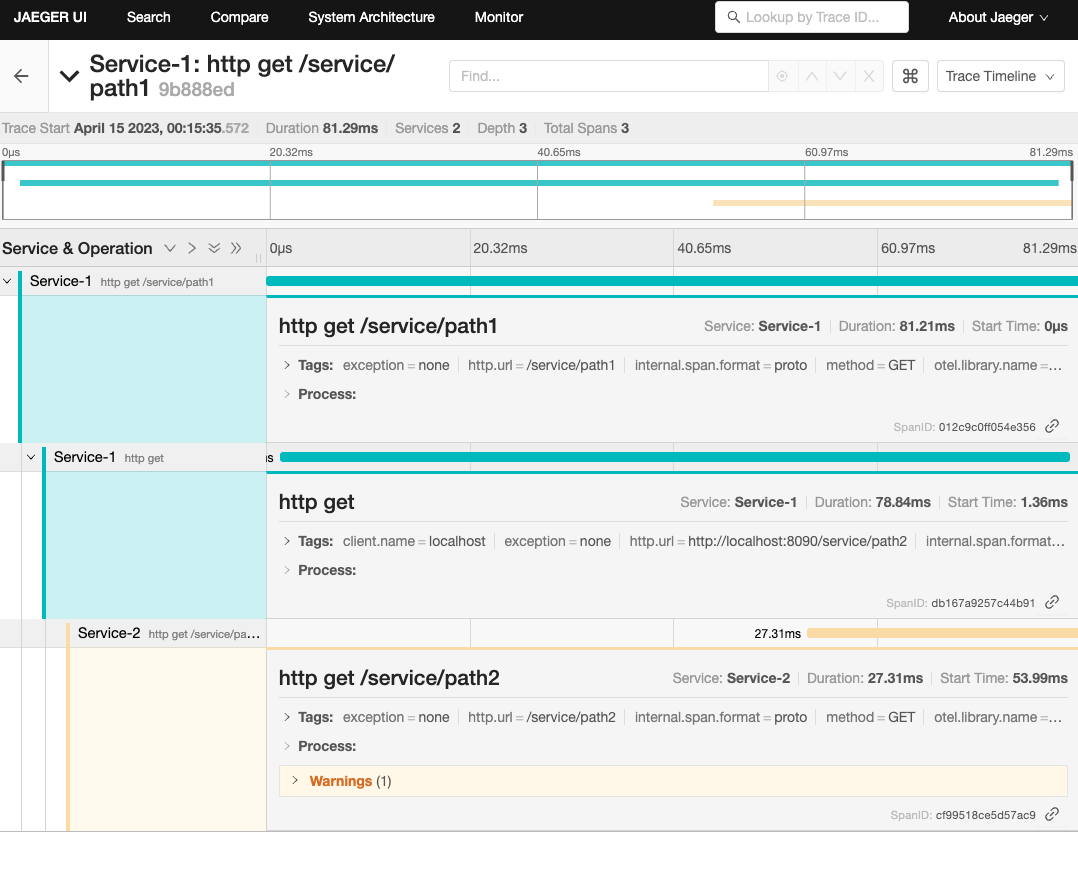
Here we can see the various span and how much time each span took along with span id. You can correlate the spans with the log lines of each of the services as shown below.
Service-1 log:

INFO [Service-1,9b888edfe46d05bfe3bd06f690bff0af,012c9c0ff054e356] 17505 --- [nio-8080-exec-2] com.amrut.prabhu.Controller: Incoming request at Service-1 for request /path1
Service-2 log:
INFO [Service-2,9b888edfe46d05bfe3bd06f690bff0af,cf99518ce5d57ac9] 22322 --- [nio-8090-exec-1] com.amrut.prabhu.Controller: Incoming request at Service-2 at /path2
You can find the complete code on my GitHub repository here.
Next …
If you’re interested in exploring more articles related to software development, here are some more recommendations:
- 3 Ways to Create Spring Boot Docker Images Without Docker File
- Using Spring Cloud Stream With Kafka
- Kind — A New Kubernetes Cluster
I keep exploring and learning new things. If you want to know the latest trends and improve your software development skills, then subscribe to my newsletter below and also follow me on Twitter.
Enjoy!!