
- Published on
Distributed Tracing With Spring Cloud Jaeger

- Authors
- Name
- Amrut Prabhu
- @amrutprabhu42

In this article, we will explore how to implement distributed tracing using Jaeger in a Spring Boot Application and visualize the traces using Jaeger UI.
Introduction
Jaeger is an open-source distributed tracing mechanism that helps to trace requests in distributed systems. It is based on OpenTracing specifications and is a part of the Cloud Native Computing Foundation (CNCF).
I have explained some key concepts of tracing in my previous article “Distributed Tracing With Spring Cloud Sleuth”.
With this, let’s look at some code.
Implementing Jaeger Tracing
Let’s create an application from https://start.spring.io with only a single dependency “Spring Web”.
Once you generate and download the code, we will add the following Jaeger dependency to the pom file which will help to generate and propagate the traces between the services.
<dependency>
   <groupId>io.opentracing.contrib</groupId>
   <artifactId>opentracing-spring-jaeger-cloud-starter</artifactId>
   <version>3.3.1</version>
</dependency>
With this, let's add a controller with some paths.
@RestController
@RequestMapping("/service")
public class Controller {

    private static final Logger logger = LoggerFactory.getLogger(Controller.class);
    private RestTemplate restTemplate;

    @Value("${spring.application.name}")
    private String applicationName;

    public Controller(RestTemplate restTemplate) {
        this.restTemplate = restTemplate;
    }

    @GetMapping("/path1")
    public ResponseEntity path1() {

        logger.info("Incoming request at {} for request /path1 ", applicationName);
        String response = restTemplate.getForObject("http://localhost:8090/service/path2", String.class);
        return ResponseEntity.ok("response from /path1 + " + response);
    }

    @GetMapping("/path2")
    public ResponseEntity path2() {
        logger.info("Incoming request at {} at /path2", applicationName);
        return ResponseEntity.ok("response from /path2 ");
    }
}
Here, we have two endpoints /path1 and /path2 . The idea here is to use two instances of the same application such that /path1 calls /path2 of another service at a fixed port 8090.
For the spans to get connected to the same trace id, We need to create a RestTemplate bean to allow Jaeger to include an interceptor. This then helps to add traces to the outgoing request which will help to trace the entire request.
@Bean
   public RestTemplate restTemplate(RestTemplateBuilder builder) {
      return builder.build();
   }
With this done, Let’s start a Jaeger Server locally using docker. For this, I have created a docker-compose file with the port mappings.
version: '3.3'
services:
  jaeger-allinone:
    image: jaegertracing/all-in-one:1.25
    ports:
      - 6831:6831/udp
      - 6832:6832/udp
      - 16686:16686
      - 14268:14268
We can communicate with Jaeger using either UDP or TCP. After starting the docker image using docker-compose up , we can access the UI using the URL http://localhost:16686/
Now, let's add some properties to allow the application to send the traces to the Jaeger server. We will communicate via TCP, so make sure that we send the traces to the other TCP port. i.e 14268
opentracing:
  jaeger:
    http-sender:
      url: http://localhost:14268/api/traces
Let’s start “Server 1” with the below command.
java -jar \
target/Distributed-Service-0.0.1-SNAPSHOT.jar \
--spring.application.name=Service-1 \
--server.port=8080
Then on a different terminal, run a new instance of the same application as “Service 2” as follows
java -jar \
target/Distributed-Service-0.0.1-SNAPSHOT.jar \
--spring.application.name=Service-2 \
--server.port=8090
Once the application starts, call “Service 1” at /path1 as follows
curl -i http://localhost:8080/service/path1
Let’s look at the logs of “Service 1”.
INFO 69938 --- [nio-8080-exec-1] i.j.internal.reporters.LoggingReporter : Span reported: ed70bbaa2bd5b42f:c7c94163fc95fc1e:ed70bbaa2bd5b42f:1 - GET
The tracing is of the format [Root Span Id, Current Span Id, Parent Span Id]. In this case, since “Service 1” is the originating service, the parent span Id “ed70bbaa2bd5b42f” is also the root span id.
Now, let’s look at the logs of “Service 2”.
INFO 69885 --- [nio-8090-exec-1] i.j.internal.reporters.LoggingReporter : Span reported: ed70bbaa2bd5b42f:e9060cb1d5336c55:c7c94163fc95fc1e:1 - path2
Here we see that the middle value is the current span id and the parent span id (ie. the third value “c7c94163fc95fc1e”) is the span id of “Service 1”.
Now, If you open the UI you will see the following.
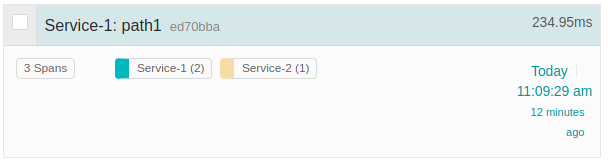
When we dig deeper, we see more details on each of the spans.
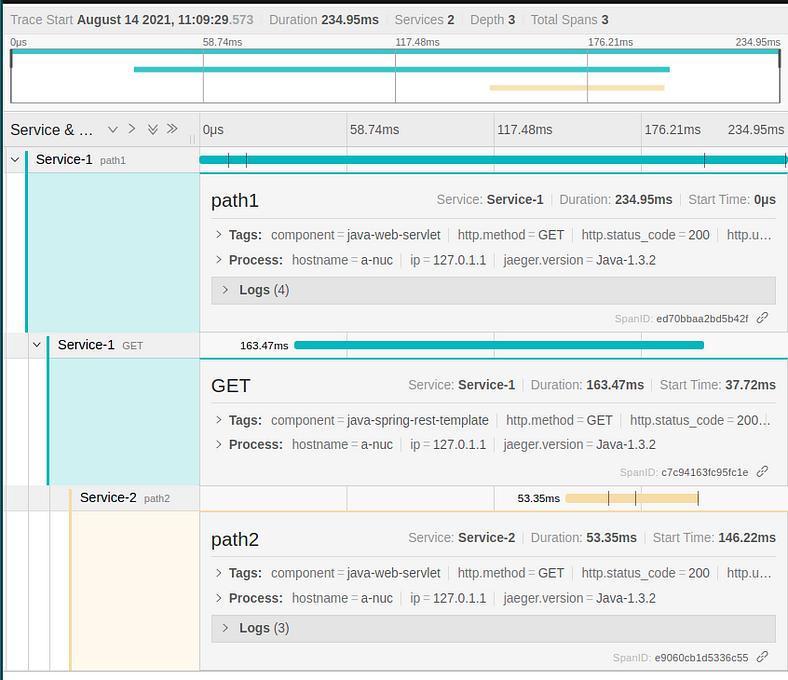
Here, the root span id “ed70bbaa2bd5b42f” spans across the entire request. The other two span ids refer to the individual services.
Conclusion
Today we explored how we can integrate Jaeger which is based on OpenTracing with a spring boot application. You can always read more in-depth about the specification of OpenTracing here. Also, the library documentation for using spring cloud Jaeger is here.
I have uploaded the code on GitHub.
You can read about Distributed tracing using Zipkin my previous article here.
I keep exploring and learning new things. If you want to know the latest trends and improve your software development skills, then subscribe to my newsletter below and also follow me on Twitter.
Enjoy!!