
- Published on


- Authors
- Name
- Amrut Prabhu
- @amrutprabhu42

In this article, we would learn how we can implement distributed tracing and understand the key concepts of distributed tracing.
Introduction
In the case of a single giant application that does everything which we usually refer to as a monolith, tracing the incoming request within the application was easy. We could follow the logs and then figure out how the request was being handled. There was nothing else we would have to look at but the application logs themselves.
Over time, monoliths become difficult to scale, to serve a large number of requests as well as delivering new features to the customer with the growing size of the codebase. This leads to breaking down the monolith into microservice which helps in scaling individual components and also helps to deliver faster.
But not all that shines is gold, right? It's the same thing with microservices. We split the entire monolith system into microservices and every request that was processed by a set of local function calls is now replaced by calling a set of distributed services. With this, we lose things like tracing a request that was easily done in a monolith. Now to trace each request we would have to look at the logs of each service and it becomes difficult to correlate.
So in the case of distributed systems, the concept of distributed tracing helps with tracing a request.
What is Distributed Tracing?
Distributed tracing is a mechanism with which we can trace a particular request throughout a distributed system. It allows us to track how a request progresses from one system to another thereby completing the user’s request.
Key concepts of Distributed Tracing.
Distributed tracing consists of two main concepts
- Trace Id
- Span Id
Trace Id is used to trace an incoming request and track it across all the composing services to satisfy a request.
Span Id is more of spans in between service calls to track each request that is received and to the response that is sent out.
let's have a look at the diagram.

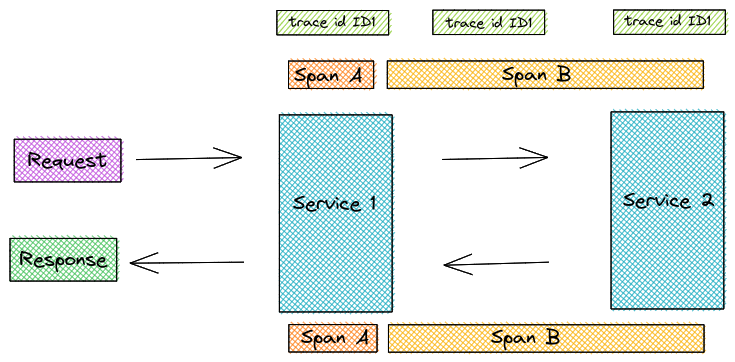
The incoming request doesn’t have any Trace id, the first service intercepting the call generates the trace id “ID1” and its span id “A”. The span id “B” covers the time from when the client at server 1 sent out the request, then server 2 receiving it, processing it, and sending out the response.
With the concepts understood, let’s now do this practically and understand more inside details.
Spring Boot Example With Spring Cloud Sleuth
Let’s create an application with spring cloud sleuth integrated. To start, let's go to https://start.spring.io/ and create an application with the dependencies “Spring Web” and “Spring Cloud Sleuth”.
Now let’s create a simple controller with two request mapping.
public class Controller {

 private static final Logger logger = LoggerFactory.getLogger(Controller.class);

 private RestTemplate restTemplate;

 @Value("${spring.application.name}")
 private String applicationName;

 public Controller(RestTemplate restTemplate) {
    this.restTemplate = restTemplate;
 }

 @GetMapping("/path1")
 public ResponseEntity path1() {

  logger.info("Request at {} for request /path1 ", applicationName);
  String response = restTemplate.getForObject("http://localhost:8090/service/path2", String.class);
  return ResponseEntity.ok("response from /path1 + "+ response);
 }

@GetMapping("/path2")
public ResponseEntity path2(){
  logger.info("Request at {} at /path2", applicationName);
  return ResponseEntity.ok("response from /path2 ");
}
Here I have created two paths, Path1 calling Path2 at a fixed port 8090. The idea here is to run two separate instances of the same application.
Now to allow sleuth to inject headers into the outgoing request, we need the RestTemplate to be injected as a bean rather than initializing it directly. This will allow sleuth to add an interceptor to the RestTemplate to inject a header with the trace id and span id into the outgoing request.
@Bean
   public RestTemplate restTemplate(RestTemplateBuilder builder) {
      return builder.build();
   }
Now, let's start the two instances. To do that, first, build the application with mvn clean verify and then run the following command to start “Service 1”
java -jar \
target/Distributed-Service-0.0.1-SNAPSHOT.jar \
--spring.application.name=Service-1 \
--server.port=8080
Then on a different terminal run “Service 2” as follows
java -jar \
target/Distributed-Service-0.0.1-SNAPSHOT.jar \
--spring.application.name=Service-2 \
--server.port=8090
Once the application starts, call “Service 1” at /path1 as follows
curl -i http://localhost:8080/service/path1
Now let’s look at the logs of “Service 1”.
INFO [Service-1,222f3b00a283c75c,222f3b00a283c75c] 41114 --- [nio-8080-exec-1] c.a.p.distributedservice.Controller : Incoming request at Service-1 for request /path1
The log contains square brackets with three parts [ Service name, Trace Id, Span Id ]. For the first incoming request, since there is no incoming trace id, the span id is the same as the trace id.
Looking at the logs of “Service 2”, we see that we have a new span id for this request.
INFO [Service-2,222f3b00a283c75c,13194db963293a22] 41052 --- [nio-8090-exec-1] c.a.p.distributedservice.Controller : Incoming request at Service-2 at /path2
I intercepted the request being sent out of “Service 1” to “Service 2” and found the following headers already present in the outgoing request.
x-b3-traceid:"222f3b00a283c75c"
x-b3-spanid:"13194db963293a22"
x-b3-parentspanid:"222f3b00a283c75c
Here we see, the span for the next operation (call to “Service 2”) is already injected in the headers. These were injected by “Service 1” when the client was sending out the request. This means the span for the next call to “Service 2” is already started from the client of “Service 1”. In the headers shown above, The span id of “Service 1” is now the parent span id for the next span.
Now to make things easier to understand, we can visually see the traces using an interceptor tool called Zipkin.
Visualizing Traces with Zipkin
To integrate Zipkin with the application, we would need to add a Zipkin client dependency to the application.
<dependency>
   <groupId>org.springframework.cloud</groupId>
   <artifactId>spring-cloud-sleuth-zipkin</artifactId>
</dependency>
On adding this dependency, the Zipkin client by default sends the traces to the Zipkin server at port 9411.
let’s start the Zipkin server using its docker image. I created a simple docker-compose file for this.
version: '3.1'
services:
  zipkin:
    image: openzipkin/zipkin:2
    ports:
      - '9411:9411'
We can now start the server using docker-compose up command. You can then access the UI at http://localhost:9411/
Since we are using the default port, we don’t need to specify any properties, But if you plan to have a different port, you would need to add the following property.
spring:
  zipkin:
    baseUrl: http://localhost:9411
With this done, let's start both the applications using the same commands from above.
On placing a request to “Service 1” at the path /path1 we get the following traces.

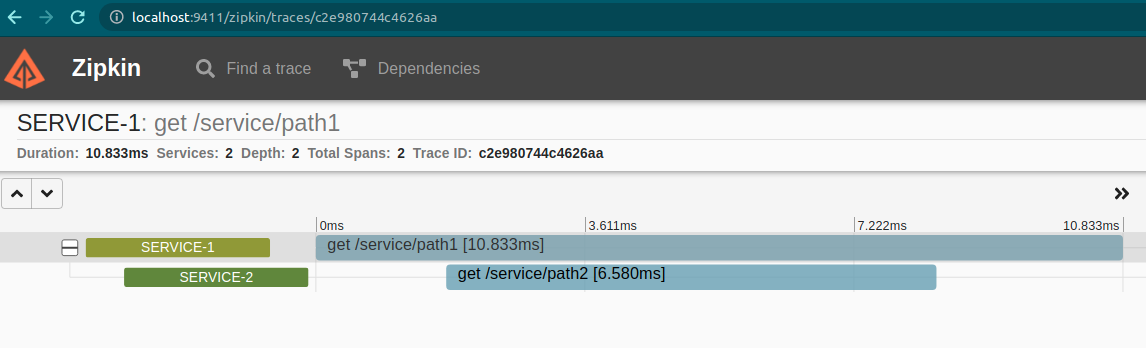
Here it shows the spans for the two services. We can dig deeper by looking at the spans.
The span for “Service 1” is a normal span covering from when it received the request to it returning a response.
The interesting one is the second span.

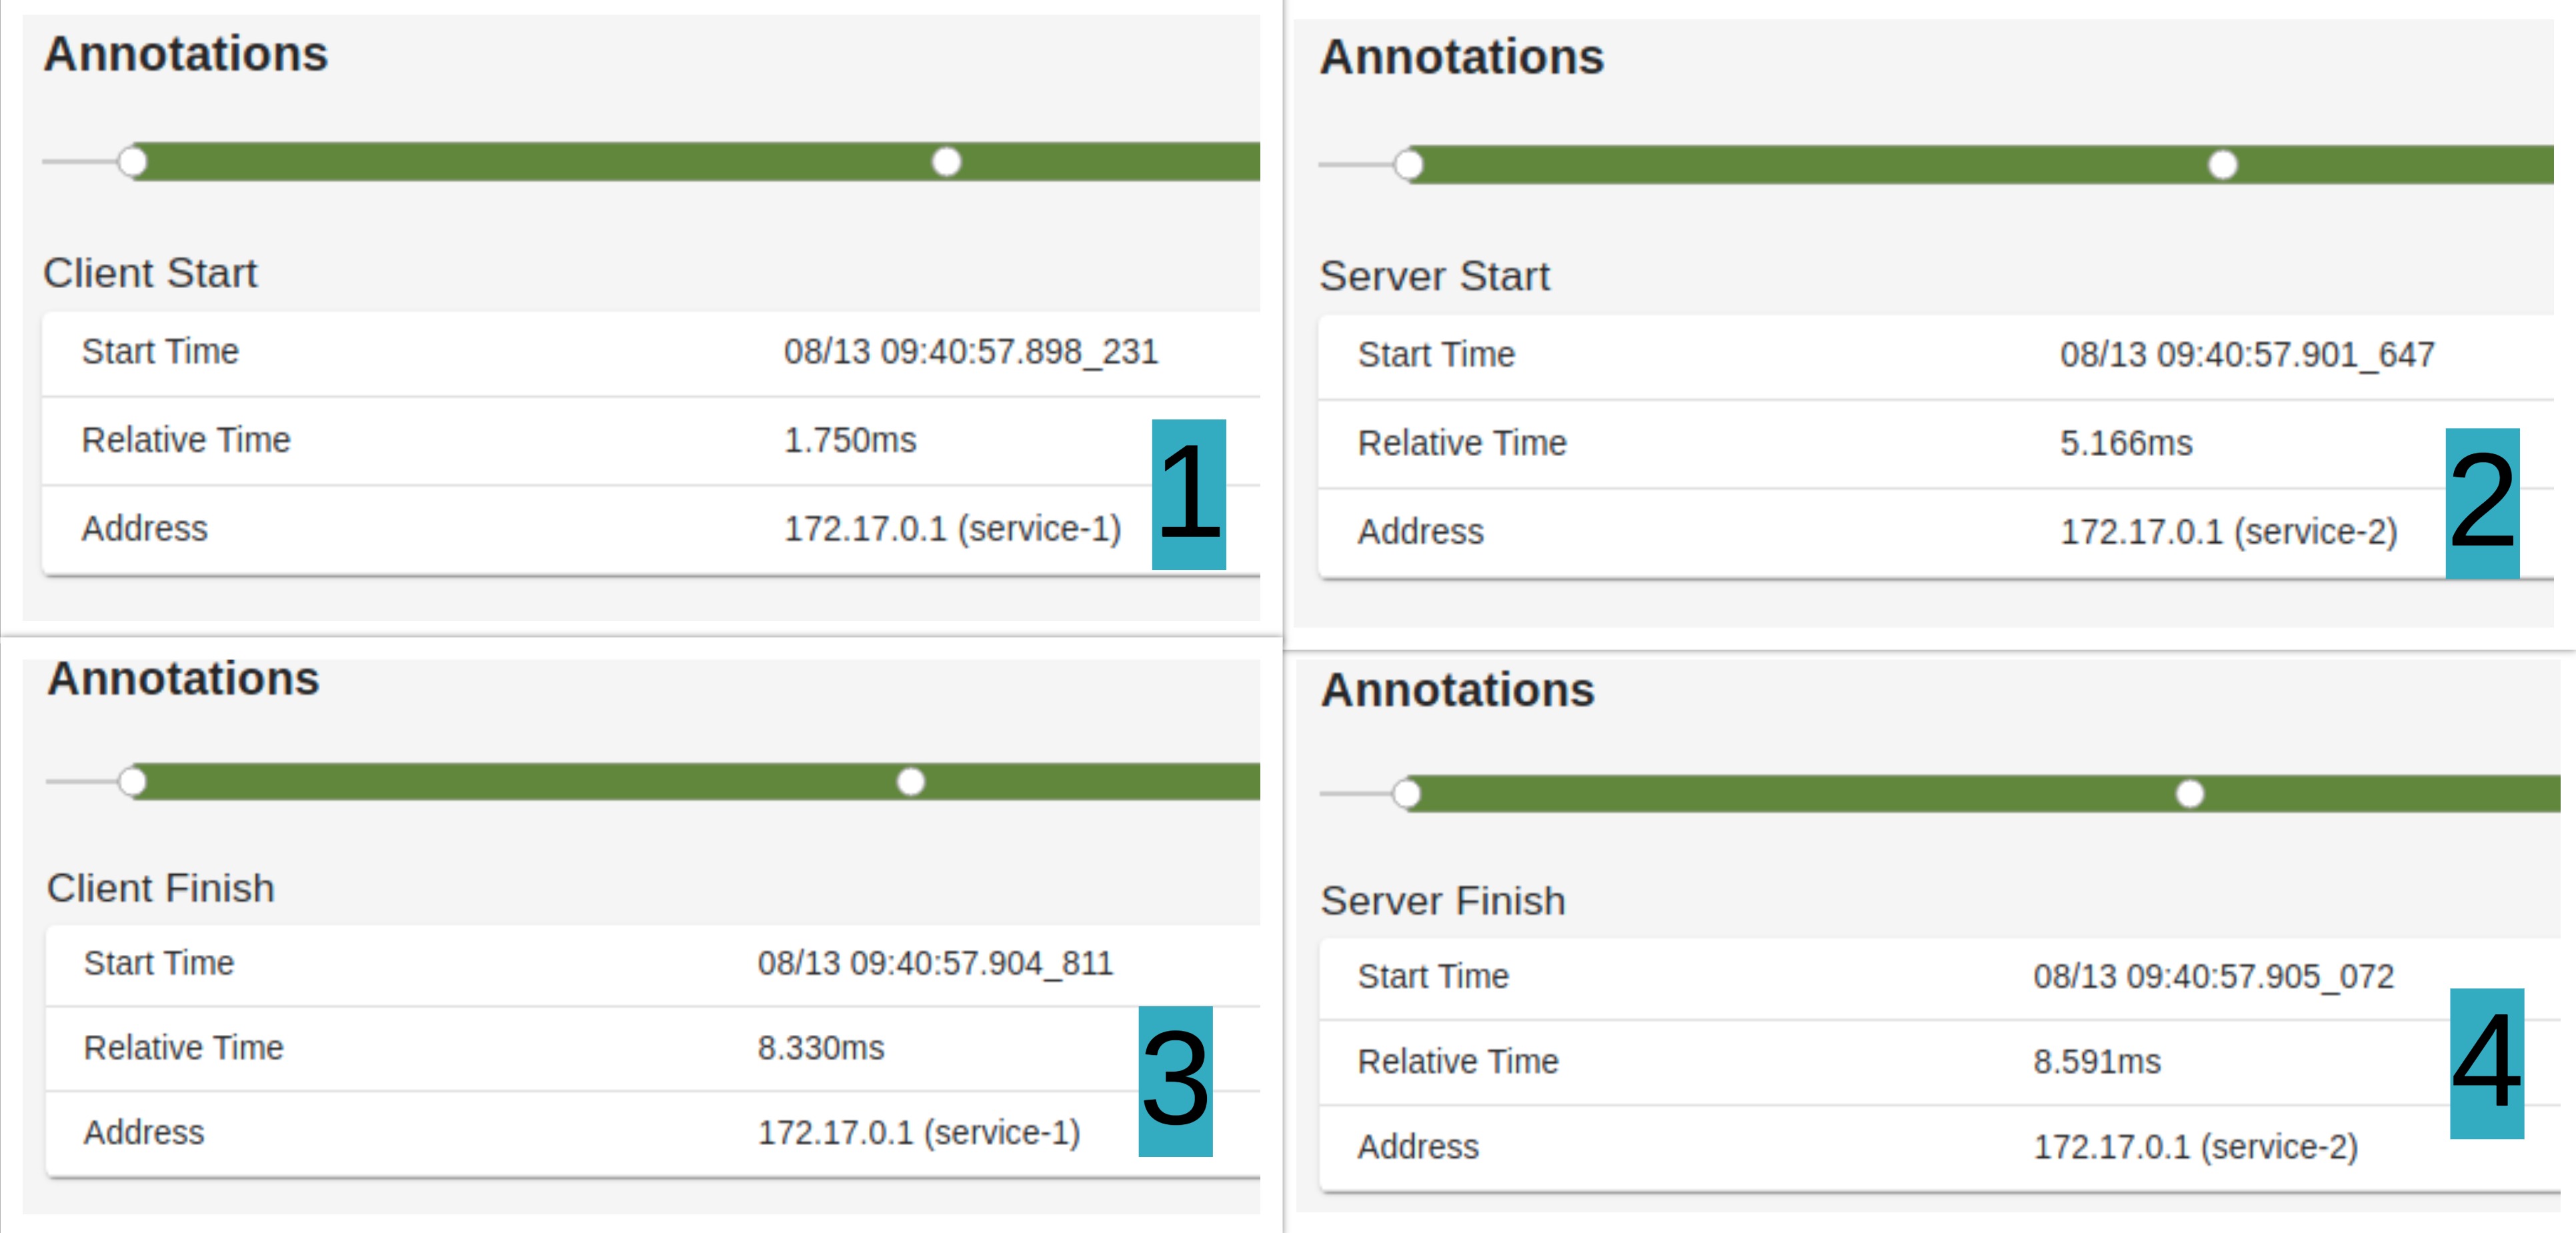
In this, there are 4 points in the span.
- The first point refers to when the client from “Service 1” started the request
- The second point is when “Service 2” started processing the request.
- The third point is when the client on “Server 1” finished receiving the response.
- And finally, the last point when “Server 2” finished.

Conclusion
So with this, we have learned how we can integrate distributed tracing with spring cloud sleuth and also visualized the traces using Zipkin.
I have uploaded the code on GitHub.
YouTube Video
You can have a visual walk-through in the video below.