
- Published on
Monitoring Spring Boot Application with Prometheus and Grafana

- Authors
- Name
- Amrut Prabhu
- @amrutprabhu42

In this article, we will be looking into how we can monitor our Spring Boot application using Grafana. We would be looking into the whole setup and create a simple dashboard to view some metrics.
Introduction
Every application that is deployed on production needs some kind of monitoring to see how the application is performing. This will give you some insights on whether the application is performing as aspected or if you would need to take some action in order to obtain the desired level of performance. In the modern world, this data is called Application Performance Metrics (APM). Now there are quite many commercial tools like Newrelic, Datadog APM, etc. which are SAAS services providing such capabilities.
Today we will be looking at two open-source tools called Grafana and Prometheus. Prometheus gathers and stores metrics data in a time series format while Grafana uses Prometheus as a data source to visualize the data on dashboards.
With this, Let’s start by creating an application and monitor it using Grafana.
Creating a Spring Boot Application
Let’s go to https://start.spring.io and create a simple application with the following dependencies.
- Spring Boot Actuator (Ops)
- Prometheus (Observability)
- Spring Web (Optional: only to create a simple REST controller.)
Next, we need to expose an actuator endpoint through which Prometheus will collect metrics data in the format that Prometheus understands. For this, we need to add the following properties.
management:
  endpoints:
    web:
      exposure:
        include:
          - prometheus
Next, Let’s add a simple controller that will produce some warning logs. We will use this to monitor the number of warnings we are getting.
@RestController
@SpringBootApplication
public class PrometheusIntegrationApplication {

    final static Logger logger = LoggerFactory.getLogger(PrometheusIntegrationApplication.class);

    public static void main(String[] args) {
        SpringApplication.run(PrometheusIntegrationApplication.class, args);
    }

    @GetMapping("/something")
    public ResponseEntity<String> createLogs() {
        logger.warn("Just checking");
        return ResponseEntity.ok().body("All Ok");
    }
}
With this, Let’s start the application and open the following URL.
http://localhost:8080/actuator/prometheus
Understanding the Metics data
After opening the above endpoint, you will find some metrics data in the following format
jvm_memory_used_bytes{area="heap",id="G1 Survivor Space",} 1005592.0
The first part i.e jvm_memory_used_bytes is called the label, while the fields inside the curly braces are called attributes. Each of these labels represents a particular metric and the attribute provides you with a way to query so that you can get the values.
Next, Let's configure Prometheus to read this data.
Configuring Prometheus
To start Prometheus, we will be using a Prometheus docker image and provide it with some configuration to gather the metrics data from our application. It does so by creating jobs that will scrape data from an endpoint. So let’s define the job in the prometheus.yamlconfiguration file as below.
scrape_configs:
  - job_name: 'Spring Boot Application input'
    metrics_path: '/actuator/prometheus'
    scrape_interval: 2s
    static_configs:
      - targets: ['localhost:8080']
        labels:
          application: 'My Spring Boot Application'
Here, I have defined a job that will call the actuator endpoint on our application every 2 seconds to get the metrics data.
Next, Let's create a docker-compose file that will bring the Prometheus docker image up and running.
services:
  prometheus:
    image: prom/prometheus:v2.35.0
    network_mode: host
    container_name: prometheus
    restart: unless-stopped
    volumes:
      - ./data/prometheus/config:/etc/prometheus/
    command:
      - '--config.file=/etc/prometheus/prometheus.yaml'
Here, we have the config file mounted at the location /etc/prometheus and we use the location of the config file as an argument to the command. For simplicity, we are using the host network mode, so that Prometheus can access our application endpoint directly.
With this, let’s start the docker image with docker compose up and open the URL http://localhost:9090 on our browser.
Now let's search for the label logback_events_total

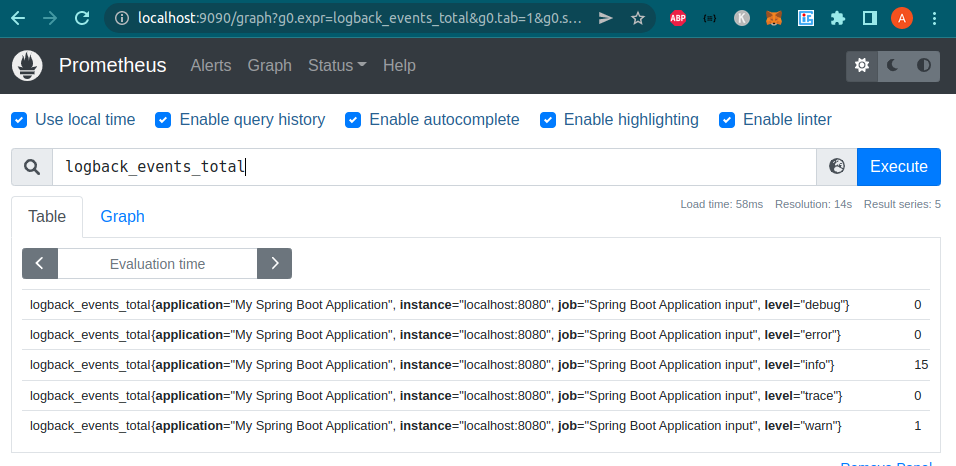
As you can see, we get to see the metric that Prometheus gathered at a particular time.
In case you don't find the label, You can check if the job is running by navigating to “Status > Targets”. You should see the state as “UP” like this.
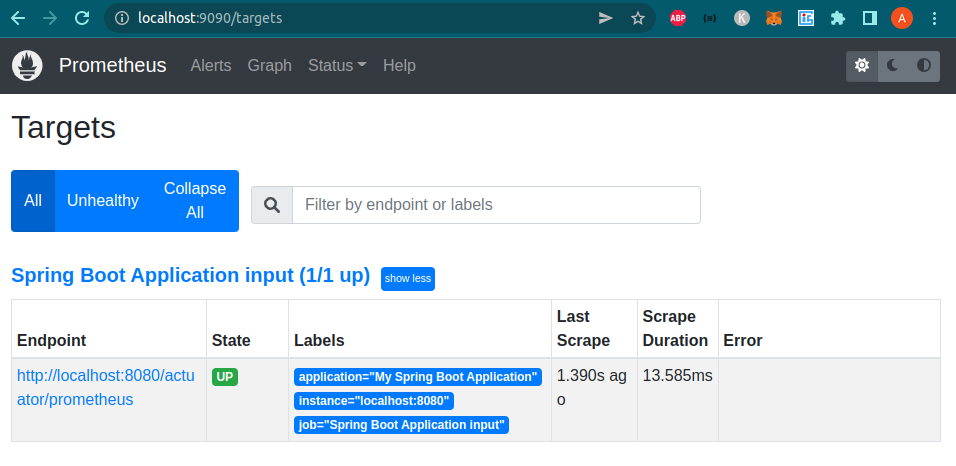
So with this, the data is getting ingested into Prometheus every 2 seconds.
Now let's visualize this using Grafana.
Visualizing Metrics in Grafana
We are going to be using Grafana’s docker image and let’s add it to the docker-compose file.
grafana:
  image: grafana/grafana-oss:8.5.2
  pull_policy: always
  network_mode: host
  container_name: grafana
  restart: unless-stopped
  volumes:
    - ./data/grafana:/var/lib/grafana
  environment:
    - GF_SECURITY_ADMIN_PASSWORD=admin
    - GF_SERVER_DOMAIN=localhost
Here also we are making use of the host network mode, to make it easy for us and Grafana to access the Prometheus endpoint.
Next, let's open the URL http://localhost:3000 and access Grafana using the username and password as “admin”
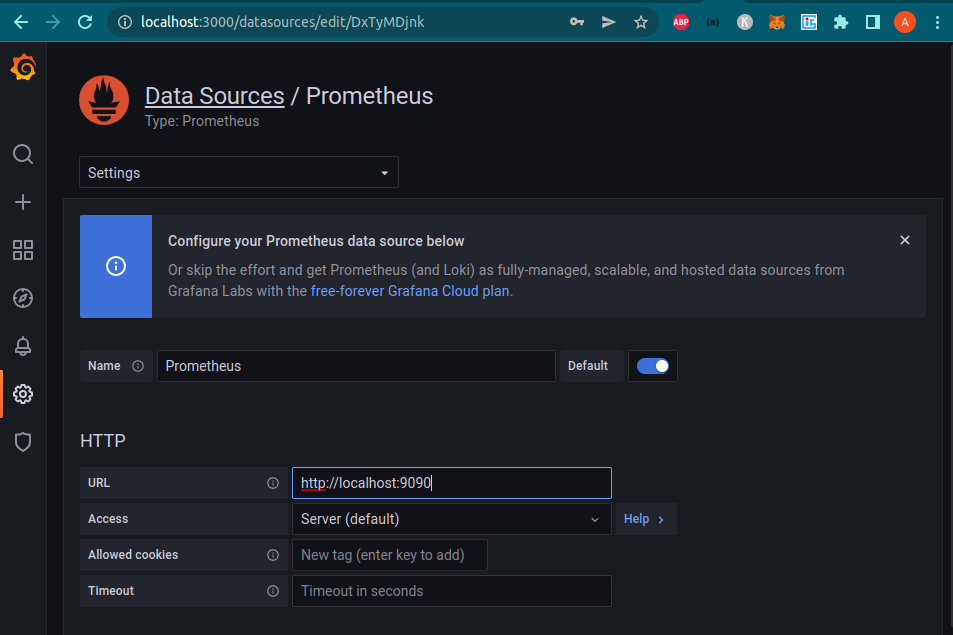
Configuring Grafana Data Source
Let’s first add the Prometheus data source. To do that, Navigate to “add a data source” and select Prometheus. Then you need to only add a single property i.e the Prometheus URL http://localhost:9090.

Click “Save and test” and now, let's create our first Dashboard
Creating Grafana Dashboard
Click on the “+” icon on the left and then select “Create Dashboard”. Now let's add our first Panel.
Next, let's query for a label in the metric browser i.e logback_events_total

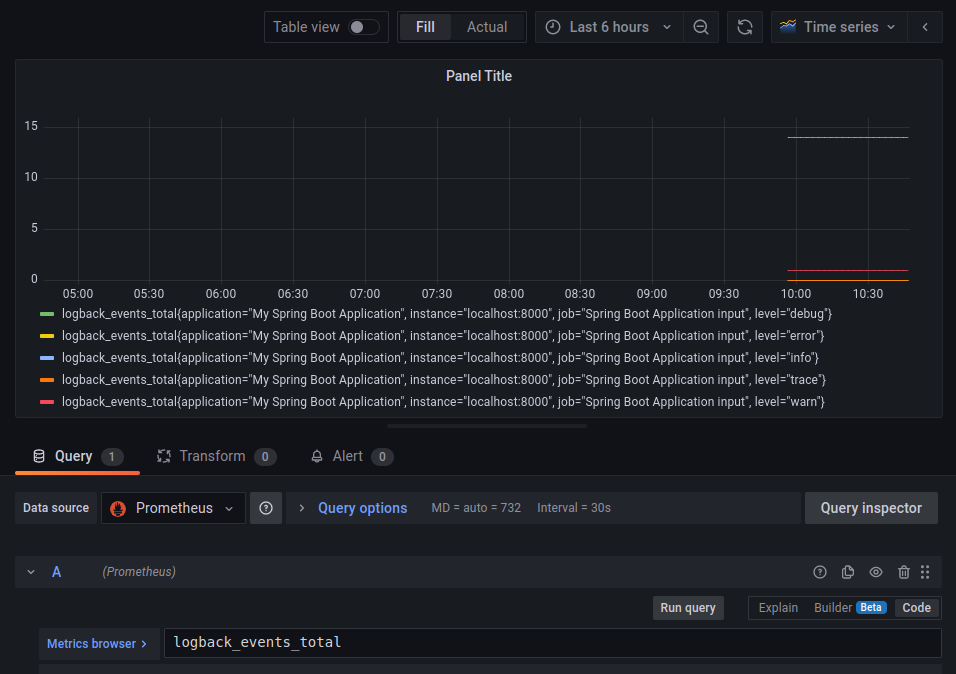
As you can see here, we get counts of all types of logs. These counts are currently from our application’s startup logs and are shown in a time-series format.
Let’s drill down to only view the warning logs. For this, we would have to add the attribute level=”warn” as below.
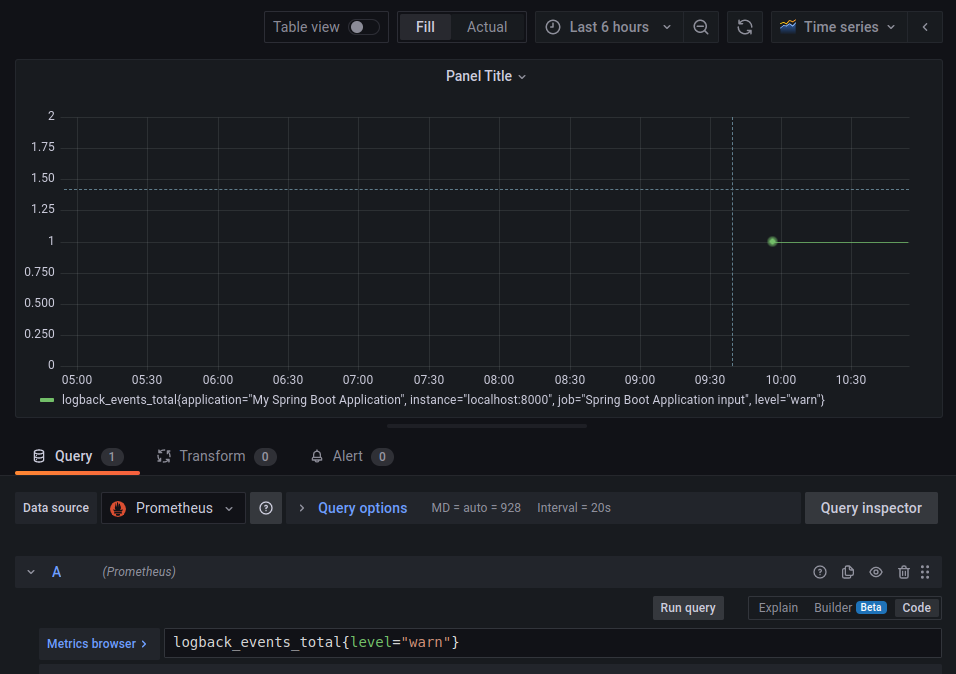
That's it. We just created a simple metric visualization panel to view the number of warning logs.
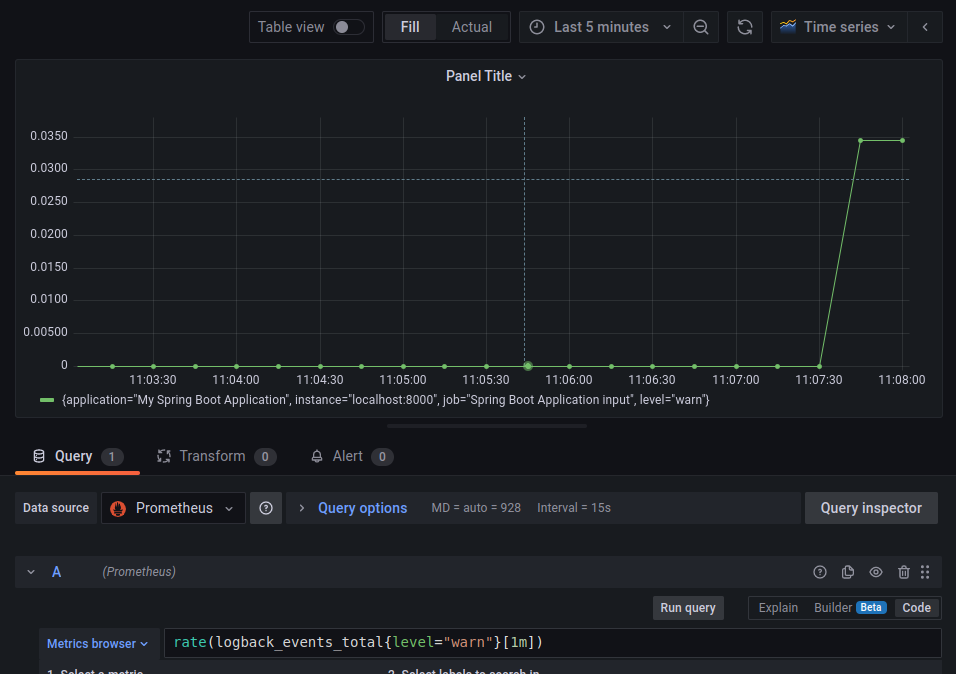
Now usually, we would like to view the rate of errors or warning logs over a certain period of time. This will help us to understand if there is some problem in our system. For this, we can use the rate function to calculate the rate of logs over a particular period of time.
So after triggering the controller endpoint on our spring boot application, it generated some warning logs, that led to this graph.
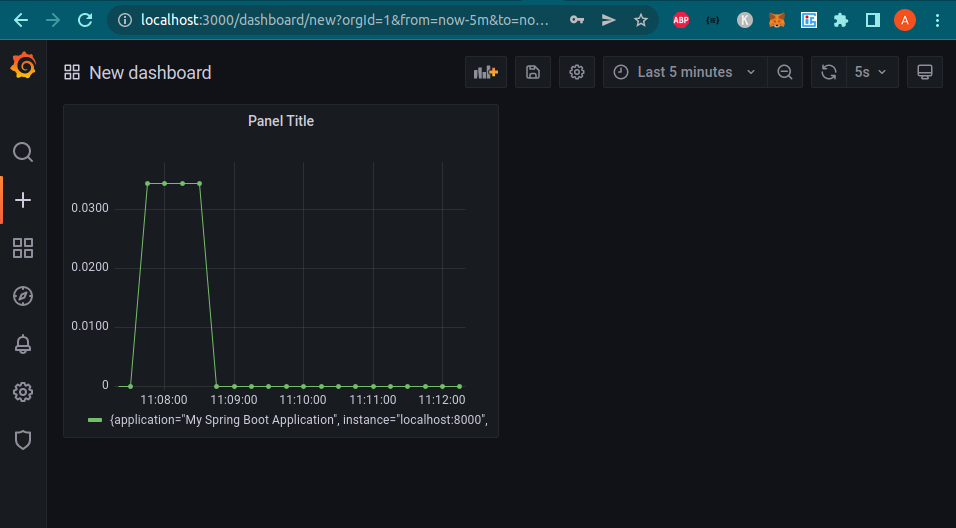
Let’s save this panel and there we go. We just created our first Grafana Dashboard with warning logs metric panel.

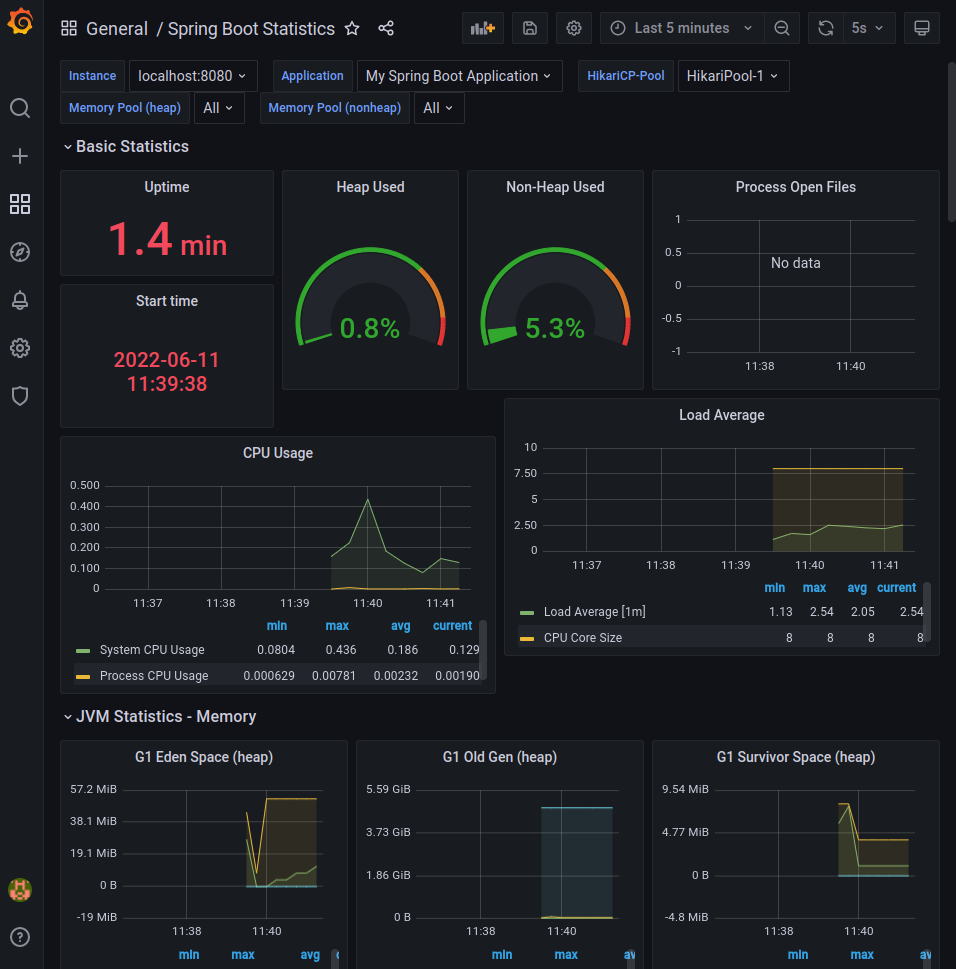
Now, We don’t need to create dashboards from scratch. Rather there are quite many community-provided dashboards. This is what I really liked. Hence you can use a full-fledged dashboard for spring boot applications from here. However, I did find some problems while trying to use it as data was not getting visualized properly. So I updated the dashboard and you can find the JSON to the dashboard in my GitHub repo here.

Conclusion
In this article, we saw how we can monitor a Spring Boot application’s performance using Prometheus and Grafana. In My next article, we will be looking into Alerting on a certain event using Grafana.
You can find the complete code and Dashboard Json on my GitHub repo here.
I keep exploring and learning new things. If you want to know the latest trends and improve your software development skills, then subscribe to my newsletter below and also follow me on Twitter.
Enjoy!!