
- Published on
How to Remote Debug A Java Application In a Kubernetes Pod

- Authors
- Name
- Amrut Prabhu
- @amrutprabhu42

Project Setup
Let’s consider we have a Java application that provides some REST endpoints and you want to debug it using your IDE.
Let’s create a simple application in Spring Boot, that provides a simple REST endpoint.
@RestController
public class WebController {
    @GetMapping("/")
    public ResponseEntity get(){
        return ResponseEntity.ok("All Works fine");
    }
}
Now, we will create a docker image of this application with maven using Google’s JIB plugin.
<plugin>
    <groupId>com.google.cloud.tools</groupId>
    <artifactId>jib-maven-plugin</artifactId>
    <version>3.2.1</version>
    <configuration>
        <from>
            <image>openjdk:17</image>
        </from>
        <to>
            <image>ghcr.io/amrutprabhu/${project.name}:${project.version}</image>
        </to>
    </configuration>
    <executions>
        <execution>
            <phase>verify</phase>
            <goals>
                <goal>build</goal>
            </goals>
        </execution>
    </executions>
</plugin>
There are other plugins to dockerize your application and you can explore some of the popular ones in my article here.
Now, when we run mvn clean verify , the docker image will be built and pushed to the GitHub repository.
Deploying Docker Images on Kubernetes
Let’s consider you already have a Kubernetes cluster to deploy your application. If not, you can run a local Kubernetes cluster using https://k3s.io.
We will be using this K3s cluster to deploy our application.
To deploy our application, we are going to create a simple helm chart with a deployment definition as follows.
apiVersion: apps/v1
kind: Deployment
metadata:
  name: application-deployment
spec:
  selector:
    matchLabels:
      app: application
  template:
    metadata:
      labels:
        app: application
    spec:
      containers:
        - image: ghcr.io/amrutprabhu/remote-application:1.0.0-SNAPSHOT
          imagePullPolicy: Always
          ports:
            - name: http
              containerPort: 8080
              protocol: TCP
            - name: debug-port
              containerPort: 5005
              protocol: TCP
          env:
            - name: JAVA_TOOL_OPTIONS
              value: '-Xdebug -agentlib:jdwp=transport=dt_socket,address=0.0.0.0:5005,server=y,suspend=n'
The most important thing for us is the environment variable JAVA_TOOL_OPTIONS set in the deployment.
Since we are using OpenJDK images, the JVM will pick up this environment variable to allow you to attach a debugger to the port 5005 .
Now, you can deploy the application using helm install <location of the helm chart>
Once you deploy the application, you need to port forward the port 5005to attach our debugger.
kubectl port-forward <your pod name> 5005:5005
Similarly, we will port forward port 8080 to call our REST endpoint.
Attaching Remote Debugger with Intellij
To attach a debugger, go to the run section in the right-hand corner and add a “Remote JVM debug” run configuration.

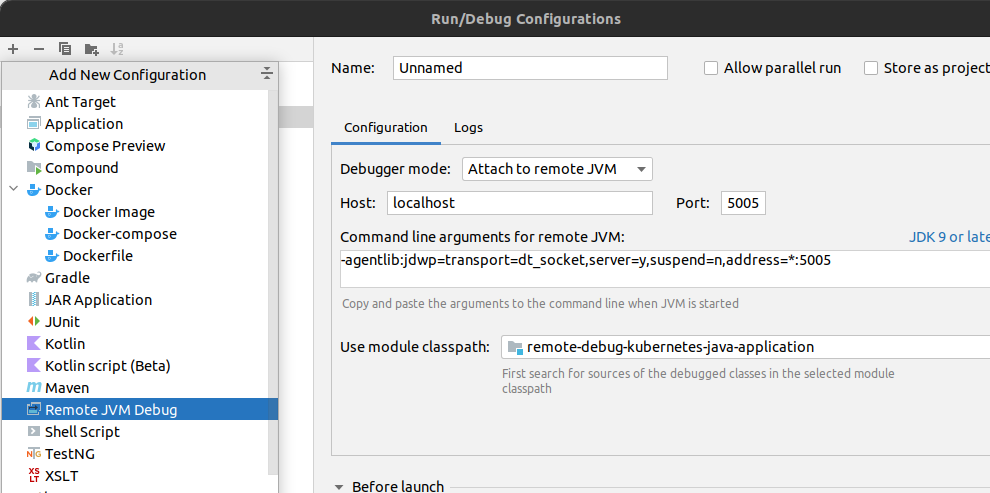
As you can see, the command line argument shown above is the same value we specified as the environment variable in the deployment file.
That is it. You can now run the configuration and the debugger will be attached.

Attaching Remote Debugger with VSCode
To attach a remote debugger using VScode, we need to add a launch configuration as below
{
  "version": "0.2.0",
  "configurations": [
    {
      "type": "java",
      "name": "Remote debugging RemoteApplication", // name for you your configuration
      "request": "attach",
      "hostName": "localhost",
      "projectName": "remote-application", //  your java project
      "port": "5005" // port to attach to
    }
  ]
}
To add this launch configuration, go to “Run and Debug” on the left bar, then click on the gear icon on the top to open “launch.json”.
Once this is done, start the configuration and the debugger will be attached. Add your breakpoint and send a request on the endpoint for the debugger to pause the execution as shown below.

I keep exploring and learning new things. If you want to know the latest trends and improve your software development skills, then subscribe to my newsletter below and also follow me on Twitter.
Enjoy!!